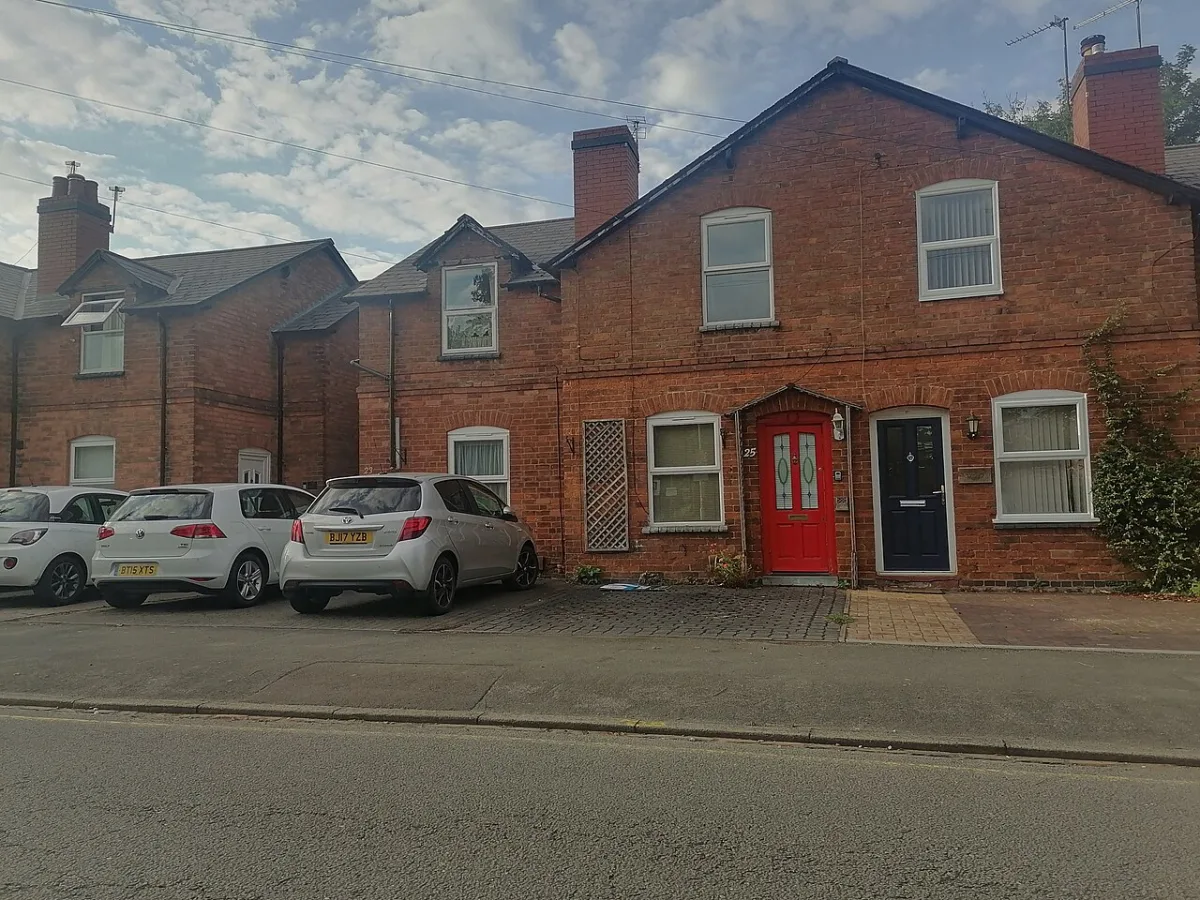

The average Solihull home sells for £336,572, up 4% in a year (Land Registry). Prices by type, the £1.9m road, and the ladder from Knowle to Chelmsley Wood.
What a Solihull house is “worth” depends on which number you read. Asking prices are hopes; the figure that matters is what buyers actually paid, which HM Land Registry records when each sale completes. This page reads those sold-price figures plainly: the borough average, what each property type goes for, the roads where sales clear £1.5 million, and the local ladder from Knowle and Dorridge down to Chelmsley Wood.
The quick answer
The official UK House Price Index puts the average price of a home in Solihull borough at £336,572 for May 2026, up 4.0% on the year. That is the strongest annual rise of any of the big local markets: Birmingham next door actually fell 0.3% over the same twelve months, and England as a whole managed just 2.3%.
The borough figure covers everywhere from Dorridge to Chelmsley Wood, which is why the town-level numbers read differently. HM Land Registry data compiled by PropertySolvers puts the Solihull town rolling-year average at £339,242, and Rightmove’s sold-price page for the town, which skews to the leafier core postcodes, puts the last year’s average at £401,450. All three are real Land Registry sold prices; they just draw the boundary differently.
What it means for you
If you are selling, the volume numbers matter more than the average. Solihull recorded 1,201 residential sales in the last year, down more than a third on the year before, homes take an average of 105 days from listing to completion, and the typical sale completes about £9,925 (2%) under asking. In June 2026 there were 283 new listings, 212 agreed sales and 206 price reductions, so almost as many sellers cut their price as found a buyer; realistic pricing from day one is what separates the two columns. If you are buying, the 4% annual rise means waiting is not free, and the most-sold band, £260,000 to £350,000 (352 sales), is where competition concentrates. A first-time buyer in the borough paid an average of £269,262 in May 2026, up 4.2% on the year, while a home mover paid £409,076; the £140,000 gap between those figures is, in effect, the step from a first terrace or flat to a family semi.
Prices by property type
The UK House Price Index breaks the borough down by type. These are the Solihull borough figures for May 2026:
- Detached houses: £597,368, up 3.3% on the year, and in Knowle, Dorridge and Balsall Common routinely far beyond that.
- Semi-detached houses: £351,037, up 5.3%, joint-fastest riser. The classic Shirley and Olton family home.
- Terraced houses: £268,303, also up 5.3%.
- Flats and maisonettes: £185,435, up 1.5%, the clear laggard.
The local ladder, from Knowle to Chelmsley Wood
One borough, very different markets. Here is the ladder: dark bars are Rightmove sold-price averages for the last twelve months by locality, pale bars are the May 2026 UK House Price Index benchmarks.
Knowle averages £610,137 and Dorridge £606,000, both detached-majority village markets (and both cooling from their 2023 peaks: Knowle is 7% and Dorridge 22% below them, though Dorridge’s small sales sample makes its swings noisy). Balsall Common at £531,540 fills the gap to Solihull town at £401,450, which is 3% above its 2023 peak. Olton at £310,300 is the semi-detached middle, and Chelmsley Wood at £197,511, terraced-majority, is the borough’s value market, sitting below even the Birmingham average. The same council serves both ends of a £412,000 spread.
The most expensive streets
The town’s priciest addresses cluster in the conservation streets south and east of the town centre, according to sold-price records compiled by PropertySolvers:
- Alderbrook Road (B91 1NW): £1,923,750 average, the town’s record stretch; two other sections of the same road average £1,548,666 and £1,295,000.
- Lovelace Avenue (B91): £1,402,200.
- St Bernards Road (Olton): £1,348,750.
At the other end, the cheapest recorded average is £76,343 on Warwick Road in Olton, flat and retirement stock rather than houses. The spread between the two ends of the same town is more than £1.8 million, which is why “the Solihull average” on its own tells you very little about any one street.
How Solihull compares
Solihull sits £103,000 above the West Midlands county average (£233,957) and £44,000 above the England average (£292,095) on the May 2026 UK House Price Index, and more than £100,000 above Birmingham (£232,657). Even the affluent Warwickshire districts next door only just clear it: Warwick district averages £366,942 and Stratford-on-Avon £392,880, both rising more slowly than Solihull’s 4.0%.
The pull is not hard to explain: the borough combines direct Chiltern trains to London and a ten-minute run into Birmingham with well-regarded schools, the parks and countryside covered in things to do in Solihull, and the jobs anchored by JLR, the NEC and the airport. What gets built next, from the HS2 Interchange quarter to the Mell Square regeneration, is tracked in our Solihull planning news.
Frequently asked questions
What is the average house price in Solihull?
The average home in Solihull borough cost £336,572 in May 2026 on the official UK House Price Index, up 4.0% on the year. Town-level sold-price averages run from £339,242 (PropertySolvers) to £401,450 (Rightmove) depending on the boundary drawn.
Are Solihull house prices going up or down in 2026?
Up. The borough index rose 4.0% in the year to May 2026, ahead of England (2.3%), the West Midlands county (2.2%) and Birmingham, which fell 0.3%. Semis and terraces led at 5.3%; flats rose just 1.5%. The village markets are the exception: Knowle and Dorridge are still below their 2023 peaks.
How much is a semi-detached house in Solihull?
Across the borough, a semi-detached home averaged £351,037 in May 2026, up 5.3% on the year. Detached homes averaged £597,368, terraces £268,303 and flats £185,435.
Where are the most expensive houses in Solihull?
By locality, Knowle (£610,137) and Dorridge (£606,000) hold the top of the ladder. By street, Alderbrook Road in Solihull town is the record, with one stretch averaging £1,923,750 in Land Registry sold-price records.
Why is Solihull so much more expensive than Birmingham?
The borough average (£336,572) is some £104,000 above Birmingham’s (£232,657), and the gap is widening: Solihull rose 4.0% in the year to May 2026 while Birmingham slipped 0.3%. Schools, rail links and the detached-heavy housing stock in the south of the borough do most of the work.
Where can I check what a specific house sold for?
Every completed sale in England and Wales is public. Look up any street or address free on the HM Land Registry Price Paid service, or browse the same data on Rightmove and Zoopla.
Sources
- UK House Price Index, Solihull (HM Land Registry) for the borough average, property-type, buyer-type and annual-change figures (May 2026), and the ONS local housing prices explorer for the same district.
- PropertySolvers Solihull house prices (HM Land Registry data) for the town average, sales volume, days to sell, asking-price gap, June 2026 market activity and street records.
- Rightmove sold-price pages for Solihull, Knowle, Dorridge, Balsall Common, Olton and Chelmsley Wood (locality averages, last 12 months).
- UK House Price Index regional data for England, the West Midlands, Birmingham, Warwick and Stratford-on-Avon (May 2026).
- HM Land Registry Price Paid search to check any individual address.
Figures are provisional and revised as more sales complete; rolling-year locality figures and monthly index figures cover slightly different windows. Always confirm the latest numbers against the linked HM Land Registry sources before making a decision. Checked August 2026.
Have your say