
4,860 people in Solihull were claiming out-of-work benefits in October, the most since February 2022. Claims by 18 to 24 year olds are up 16% in a year.
4,860 people in Solihull were claiming benefits principally for being out of work in October 2026. That is the highest count in the borough since February 2022.
The figure is 3.7% of residents aged 16 to 64. The ONS published it on 17 November in its monthly claimant count, which nomis breaks down by borough and ward. (ONS claimant count via nomis, dataset NM_162_1)
Overview
- 4,860 claimants in October 2026, up 105 on September and up 235 on October 2025.
- That is a 5.1% rise in a year, faster than the UK (3.5%) and the West Midlands metropolitan county (3.3%).
- Claims by 18 to 24 year olds reached 1,220, the most since August 2021.
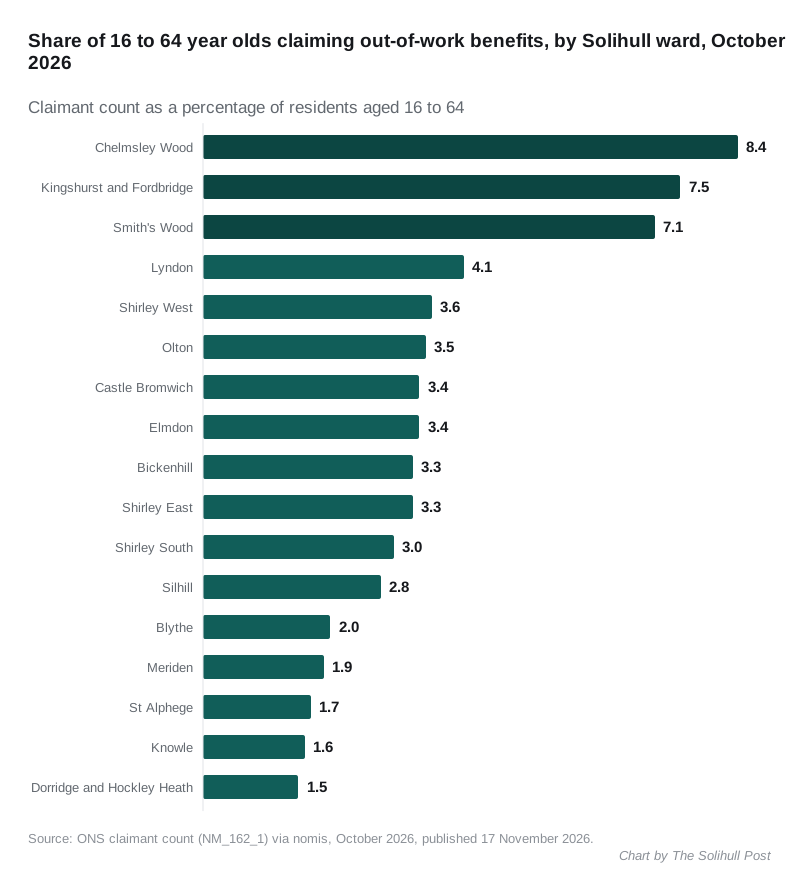
- Chelmsley Wood (8.4%), Kingshurst and Fordbridge (7.5%) and Smith’s Wood (7.1%) have the highest rates. Dorridge and Hockley Heath has the lowest, at 1.5%.
- Solihull’s rate is still below the UK’s 3.9% and well below Birmingham’s 10.2%.
The trend: flat for two years, then three monthly rises
For most of the last two years the borough count barely moved. It sat between 4,585 and 4,790 every month from October 2024 to July 2026.
Then it rose three months running:
| Month | Claimants in Solihull |
|---|---|
| July 2026 | 4,625 |
| August 2026 | 4,665 |
| September 2026 | 4,755 |
| October 2026 | 4,860 |
The last time the count was higher was February 2022, at 4,965, as numbers were still falling after the pandemic peak.
The rise is not only a Solihull story. The UK count went up by 34,420 between September and October, to 1,707,320. Across the seven West Midlands metropolitan boroughs it rose to 145,345.
Young people are driving it
Most of the year’s increase is among 18 to 24 year olds. Their count rose from 1,055 in October 2025 to 1,220 in October 2026, an increase of 165, or 16%.
Older groups moved far less over the same year:
- 25 to 49: up from 2,500 to 2,530
- 50 and over: up from 1,060 to 1,100
We reported in August that under-25 claims had risen almost a third in two years while older age groups fell. October’s figures show that gap still widening.
Where in Solihull
The north of the borough has rates two to five times those in the south. Nomis publishes the ward figures from August 2026 onwards for Solihull’s current wards, so a year-on-year comparison by ward is not yet possible.
| Ward | Claimants, October 2026 | Share of 16 to 64s |
|---|---|---|
| Chelmsley Wood | 675 | 8.4% |
| Kingshurst and Fordbridge | 635 | 7.5% |
| Smith’s Wood | 560 | 7.1% |
| Lyndon | 355 | 4.1% |
| Shirley West | 285 | 3.6% |
| Olton | 260 | 3.5% |
| Castle Bromwich | 225 | 3.4% |
| Elmdon | 260 | 3.4% |
| Bickenhill | 270 | 3.3% |
| Shirley East | 235 | 3.3% |
| Shirley South | 220 | 3.0% |
| Silhill | 215 | 2.8% |
| Blythe | 210 | 2.0% |
| Meriden | 135 | 1.9% |
| St Alphege | 125 | 1.7% |
| Knowle | 95 | 1.6% |
| Dorridge and Hockley Heath | 95 | 1.5% |
Ward figures are rounded to the nearest five, so they add up to 4,855 rather than the borough’s 4,860.
Kingshurst and Fordbridge had the biggest monthly rise, up 25 from 610 in September. Bickenhill, Olton and Shirley West each rose by 15. Blythe fell by 10.
What the figure counts
The claimant count includes people on Jobseeker’s Allowance and people on Universal Credit who are required to look for work. It is not the same as the unemployment rate. Some claimants are in low-paid work and must look for more hours, and some people who are out of work do not claim.
Figures are rounded to the nearest five and the most recent month is often revised a little when the next one is published, so the three-month rise matters more than any one figure.
What it means for you
- If you are out of work and live in the borough, Solihull Council’s Employment and Skills Team offers free help with job searching and applications, numeracy, literacy and digital skills, and mock interviews. It will meet you at its Solihull Recruitment and Training Centre or at a local venue, according to the council’s support for residents page, which has a form to ask for a call back.
- If you have just lost your job, you can check what you can claim on GOV.UK’s Universal Credit pages.
- If you are in school years 11 to 13, the same council page lists Skills for Success workshops and one-to-one support on careers, apprenticeships and staying in education.
The next figures, for November, are due on 15 December at 7am.
Source: ONS claimant count, NM_162_1, via nomis. Borough, regional and UK figures from the monthly series; ward figures from the 2026 ward geography (TYPE182). All figures are not seasonally adjusted.
Have your say