
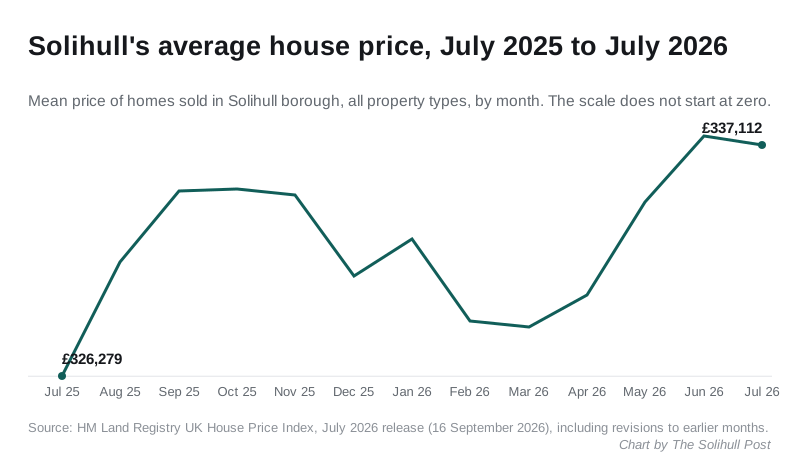
Solihull's average home cost £337,112 in July, the second highest on record. The yearly rise slowed to 3.3% after June was revised up to a record £337,526.
The average home in Solihull borough cost £337,112 in July 2026. That is £10,833 more than a year earlier, a rise of 3.3%.
It is the second highest monthly average for the borough since the index began in January 1995. The only higher month is June 2026, which has just been revised up.
The figures come from HM Land Registry’s UK House Price Index for July, published on 16 September. (UK House Price Index for July 2026, GOV.UK)
June was revised up to a record
When we reported the June figures on 11 September, the borough average was £334,966 and the annual rise was 4.2%.
The July release has revised June up. It now stands at £337,526, a rise of 5.0% on a year earlier. That makes June 2026 the highest month in the series. The previous peak was £335,813 in October 2022. (UKHPI, Solihull, 1995 to 2026)
Revisions like this are normal. The early figures for a month are based on the sales registered so far, and later registrations fill in the picture. So treat the newest month, including July, as provisional.
Why the yearly rise slowed
Prices barely moved between June and July: the July average is £414 lower, a fall of 0.1%.
The annual rate still dropped from 5.0% to 3.3%. That is because of what July is being compared with. In July 2025 the borough average jumped to £326,279, up 1.5% in a single month, at the start of last summer’s rise. A higher starting point means a smaller yearly gain.
We said in September this would happen once last summer’s months came into the comparison. August and September 2025 were higher again, at £331,610 and £334,948. Unless prices climb from here, the annual rate will keep falling over the next two releases.
Terraces and semis led the year
Every property type rose over the year, but flats barely moved:
| Type | July 2025 | July 2026 | Change |
|---|---|---|---|
| Detached | £582,191 | £599,812 | +£17,621 (+3.0%) |
| Semi-detached | £336,485 | £351,666 | +£15,181 (+4.5%) |
| Terraced | £257,488 | £269,243 | +£11,755 (+4.6%) |
| Flat or maisonette | £183,537 | £184,659 | +£1,122 (+0.6%) |
Source: HM Land Registry UK House Price Index, Solihull, July 2025 to July 2026.
The average detached home is now just £188 short of £600,000.
By type of buyer, the same index shows:
- First-time buyers: £269,645, up £9,186 (3.5%)
- Existing owners moving home: £409,908, up £12,858 (3.2%)
- Mortgage buyers: £348,364, up 3.6%
- Cash buyers: £313,148, up 2.7%
How Solihull compares
Solihull is still the most expensive of the seven West Midlands metropolitan boroughs. Its average is £102,855 above Birmingham’s and £43,633 above the average for England.
In July it also edged just above Bromsgrove, which was ahead of it in June.
| Area | Average, July 2026 | Change in a year |
|---|---|---|
| Stratford-on-Avon | £396,753 | +1.6% |
| Warwick | £369,220 | +1.7% |
| Solihull | £337,112 | +3.3% |
| Bromsgrove | £335,607 | +2.3% |
| England | £293,479 | +1.1% |
| North Warwickshire | £273,776 | +5.9% |
| West Midlands region | £250,880 | +1.5% |
| Birmingham | £234,257 | +2.5% |
| Dudley | £232,196 | +3.5% |
| Coventry | £227,679 | +3.7% |
| Wolverhampton | £220,559 | +7.2% |
| Walsall | £215,329 | +1.5% |
| Sandwell | £205,830 | -0.4% |
Source: HM Land Registry UK House Price Index, July 2026 figures for each area.
Solihull’s rise was three times the England figure. Wolverhampton and North Warwickshire grew faster, from lower starting prices. Sandwell was the only area in the table where prices fell.
What it means for you
- If you are buying, the typical Solihull home is about £11,000 dearer than a year ago. First-time buyers are paying about £9,000 more.
- If you are selling, the borough average is close to its highest ever. But it slipped slightly in July, and the yearly gain is shrinking.
- If you are valuing your own home, remember UKHPI is a mean average across all sales. A small number of very expensive homes pull a mean up, so the typical sale can be lower than the headline. Your own home’s value depends on its street, size and condition.
For the longer picture, with prices by area and property type, see our Solihull house prices page. Council tax bands are on our council tax page.
About the figures
The UK House Price Index is produced by HM Land Registry with the Office for National Statistics. It is a mean average, not a median, and it is mix-adjusted, so a month with lots of detached sales does not simply push the figure up. Recent months are revised as more sales are registered, which is why June moved in this release.
Sources: HM Land Registry UK House Price Index, Solihull; UK House Price Index for July 2026, GOV.UK.
Have your say